


Big markets don't always guarantee big outcomes, and most businesses fail because they overestimate how much of that market they can capture. That's why metrics like TAM, SAM and SOM move market sizing from aspiration to execution by forcing clarity on scope and reach. Let's take a deeper look at how to calculate them.
What is TAM in Business?
Also known as TAM, Total Addressable Market is the maximum revenue available to a business if it were able to capture 100% of demand within its market. TAM answers a single, strategic question: How big would the opportunity be if there were no constraints?
TAM defines a market's full potential, independent of competition, execution or real-world constraints. The Corporate Finance Institute defines it as a top-level measure that leads to untapped markets and customer segments.

How to Calculate Total Addressable Market
Total Addressable Market Top-down Approach
The top-down method for calculating TAM starts with broad, macro-level market research data and progressively narrows the focus to a relevant market segment. It takes an outside-in perspective that begins with the largest possible market, starting with the global number of users, and then applying constraints, such as geographic regions.
If a company is building a Project Management platform for mid-sized businesses, a recognized market report could estimate that the Project Management software market can generate up to $10 billion annually.
The business could then apply geographic location constraints, noting that the U.S. accounts for 60% of global software spending, thereby reducing the addressable market to $6B. It would then acknowledge that, for mid-sized businesses, software spend accounts for 40%.
This final filter yields a top-down TAM of $2.4B, calculated as: TAM = 10B [original total revenue] * 0.6 [location-based spending] * 0.4 [business-size-specific spending] = $2.4B.
Total Addressable Market Bottom-up Method
On the other hand, the bottom-up method defines product, price and customer type, then scales it across the target market. Since inputs are derived from internal analysis and research starts with ground-level data, the bottom-up approach is often seen as more credible than the top-down method.
Let's use the same example as before: the Project Management software company starts with a subscription-based service at $50/m or $600/y. If the business deploys it across 100 mid-sized customers, the average yearly revenue per customer would be $60,000.
Based on data, the company can later leverage the fact that there are approx 40,000 mid-sized businesses in America. With this information, TAM is calculated by multiplying the total size of the target audience by the average revenue per user.
The outcome would also be $2.4B, but as the result of TAM = 40.000 [number of mid-sized businesses] * 60.000 [average yearly revenue] = $2.4B. This execution-oriented figure is derived from data such as pricing, usage assumptions and identifiable customers.

What is SAM in Business
Smaller than TAM, SAM (Serviceable Available Market) is the portion of the Total Addressable Market that a company can realistically target. SAM narrows the scope to the market that's actually reachable, answering the question: Which part of this market can we serve with what we have today?
Serviceable Available Market addresses considerations such as:
- Geographic limitations
- Customer segments
- Regulatory boundaries
- Pricing models
- Product limitations
- Market-size metrics
- Offering capabilities
As it intersects market demand, for decision-makers, SAM is where business strategy begins to replace theory. A company may operate in a multi-billion-dollar TAM, but only a subset of that market aligns with its go-to-market strategy, target customer and operational footprint.
How to Calculate Serviceable Addressable Market
Calculating SAM starts with an already defined TAM and narrows it to reflect what the business plan can deliver. The process then identifies and applies the limiting factors that reduce the total market share to a serviceable subset, such as geographic coverage, target customer segments, product capabilities and technology requirements.
Each constraint removes portions of the TAM that are attractive but unreachable, whether due to the number of potential customers, the applicable revenue potential or both, and aligns the total market opportunity with the company's current reality.
In our PM software example, 40,000 mid-sized businesses in America, each generating $60,000 in annual revenue, led to a total TAM of $2.4B. The first reduction to calculate SAM would apply demographic and operational constraints.
In this example, the software would target English-speaking American customers and operate under a limited set of compliance standards. Only 28,000 companies of the original pool would be immediately serviceable, since 40,000 [total companies] * 0.7 [percentage of English-speaking companies] = 28.000.
Let's say the software is built for digitally mid-sized mature organizations with complex workflows and modern cloud infrastructure, and internal analysis shows that only 60% of the remaining companies meet these criteria. The formula shows that 16,800 companies fit this filter: 28,000 [demographic-based companies] * 0.6 [customer-fit companies] = 16,800.
Finally, SAM is calculated by multiplying the number of serviceable customers by the average annual contract value mentioned before. SAM = 16,800 [serviceable companies] * 60,000 [average yearly revenue] = ~$1.0B.

What is SOM in Business
Narrowing it down further, the Serviceable Obtainable Market (SOM) is the portion of the SAM that a company can capture within a defined time frame, accounting for go-to-market capacity, sales cycles, pricing pressure, brand awareness and execution limits.
The outcome-driven SOM estimate is grounded in real-world constraints and is the most actionable and scrutinized of the three metrics. Teams use SOM to evaluate growth targets, sales and marketing plans and business scaling.
How to Calculate Service Obtainable Market
SOM estimates market penetration based on sales capacity, customer acquisition rates and expected churn, and it's typically calculated by applying a realistic capture rate to SAM. The assumptions must be explicit, time-bound and aligned with how the business actually sells.
Using the SAM of approx. $1.0 billion for our Project Management software, we now estimate how much of that market the company can capture. Based on its sales model, the company can onboard an average of 400 new customers per year. If each customer generates an average annual contract value of $60,000, SOM = 400 [new yearly customers] * 60,000 [average annual revenue] = $24M.
TAM, SAM and SOM
Total Addressable Market (TAM), Serviceable Addressable Market (SAM) and Serviceable Obtainable Market (SOM) work together to quantify opportunities from broader ideas to realistic targets. Each subset refines the previous layer based on specific constraints.
- TAM (Total Addressable Market) is the global revenue opportunity for your product category, assuming 100% market share with no competition or geographic barriers.
- SAM (Serviceable Available Market) is the portion of TAM that your current model and product can actually reach, filtered by geography, pricing, or distribution channels.
- SOM (Serviceable Obtainable Market) is the specific slice of SAM you can realistically capture in the short-to-medium term, factoring in resources, capacity and competition.
For decision-makers, considering all three layers before making no-turning-back decisions is key, as showing a massive TAM without a logical SAM/SOM indicates a lack of strategic planning and therefore lower investor credibility.
A strong TAM > SAM > SOM hierarchy also helps with resource allocation, as management can prioritize marketing spend and sales hiring based on the reachable SAM. Last but not least, a well-analyzed SOM provides a short-term benchmark to validate business viability.
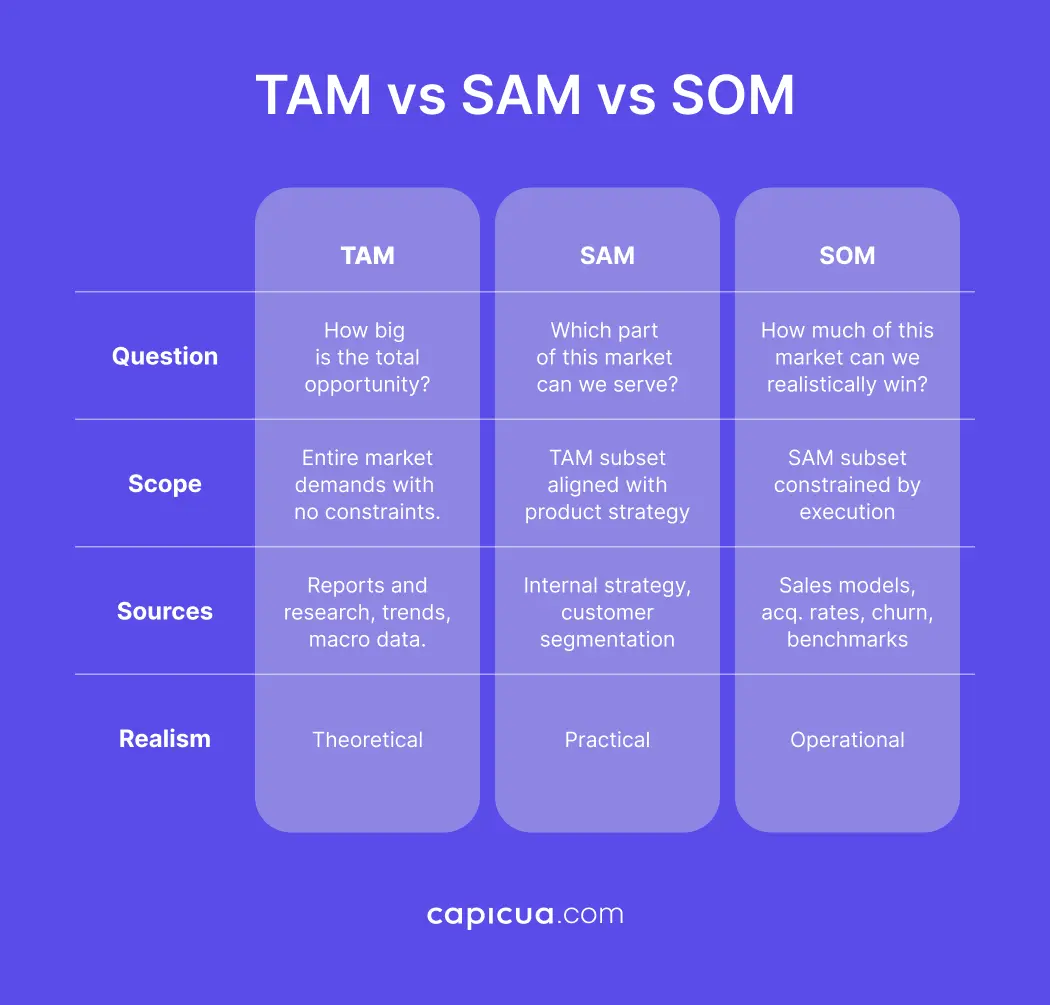
TAM vs SAM vs SOM
TAM (Total Addressable Market)
- Question: How big is the total opportunity?
- Scope: Entire market with no constraints.
- Realism: Theoretical.
- Sources: Industry reports, research, market trends, macro data.
SAM (Serviceable Available Market)
- Question: Which part of this market can we serve?
- Scope: Subset of TAM aligned with product, geography and strategy.
- Realism: Strategic and practical.
- Sources: Internal strategy, customer segmentation, GTM assumptions.
SOM (Serviceable Obtainable Market)
- Question: How much of that market can we realistically win?
- Scope: Subset of SAM constrained by competition and execution.
- Realism: Operational and time-bound.
- Sources: Sales models, acquisition rates, competitive benchmarks.
Why are TAM, SAM and SOM Important
TAM, SAM and SOM turn market segmentation into decision-making, prioritization and credibility tools. At the highest level, TAM establishes whether a business operates in a market large enough to justify investment, expansion or growth.
Consequently, SAM narrows and validates the opportunity to what a company can actually serve. The Serviceable Available Market defines where resources should be focused and prevents teams from entering into markets they can't win.
Last but not least, SOM reflects what a company can realistically capture given competition, sales capacity and time, tying market sizing directly to hiring plans, revenue forecasts and growth targets. An unrealistic SOM makes everything built on top of it—budgets, valuations, expectations—fragile.
Together, TAM, SAM and SOM create a progressive filter from possibility to execution, aligning leadership teams around shared assumptions, distinguishing vision from viability and reducing strategic risk by applying constraints.
Conclusion
By defining opportunities (TAM), setting strategic focus (SAM) and anchoring ambition in execution (SOM), your business can turn market potential into product, go-to-market and investment decisions that foster a clear, actionable path to growth.
Don't know where to start? Capicua is your go-to Product Growth partner to connect market understanding with strategic execution to drive sustainable growth. Reach out!