


SaaS companies spend around $2 in sales and marketing to generate $1 in new customer revenue, and the top-spending quartile pays close to $2.82. But when acquisition gets expensive, pouring more users into the top of the funnel stops paying off; the approach must shift to acknowledge where users enter, where they stall, and where they quietly leave.
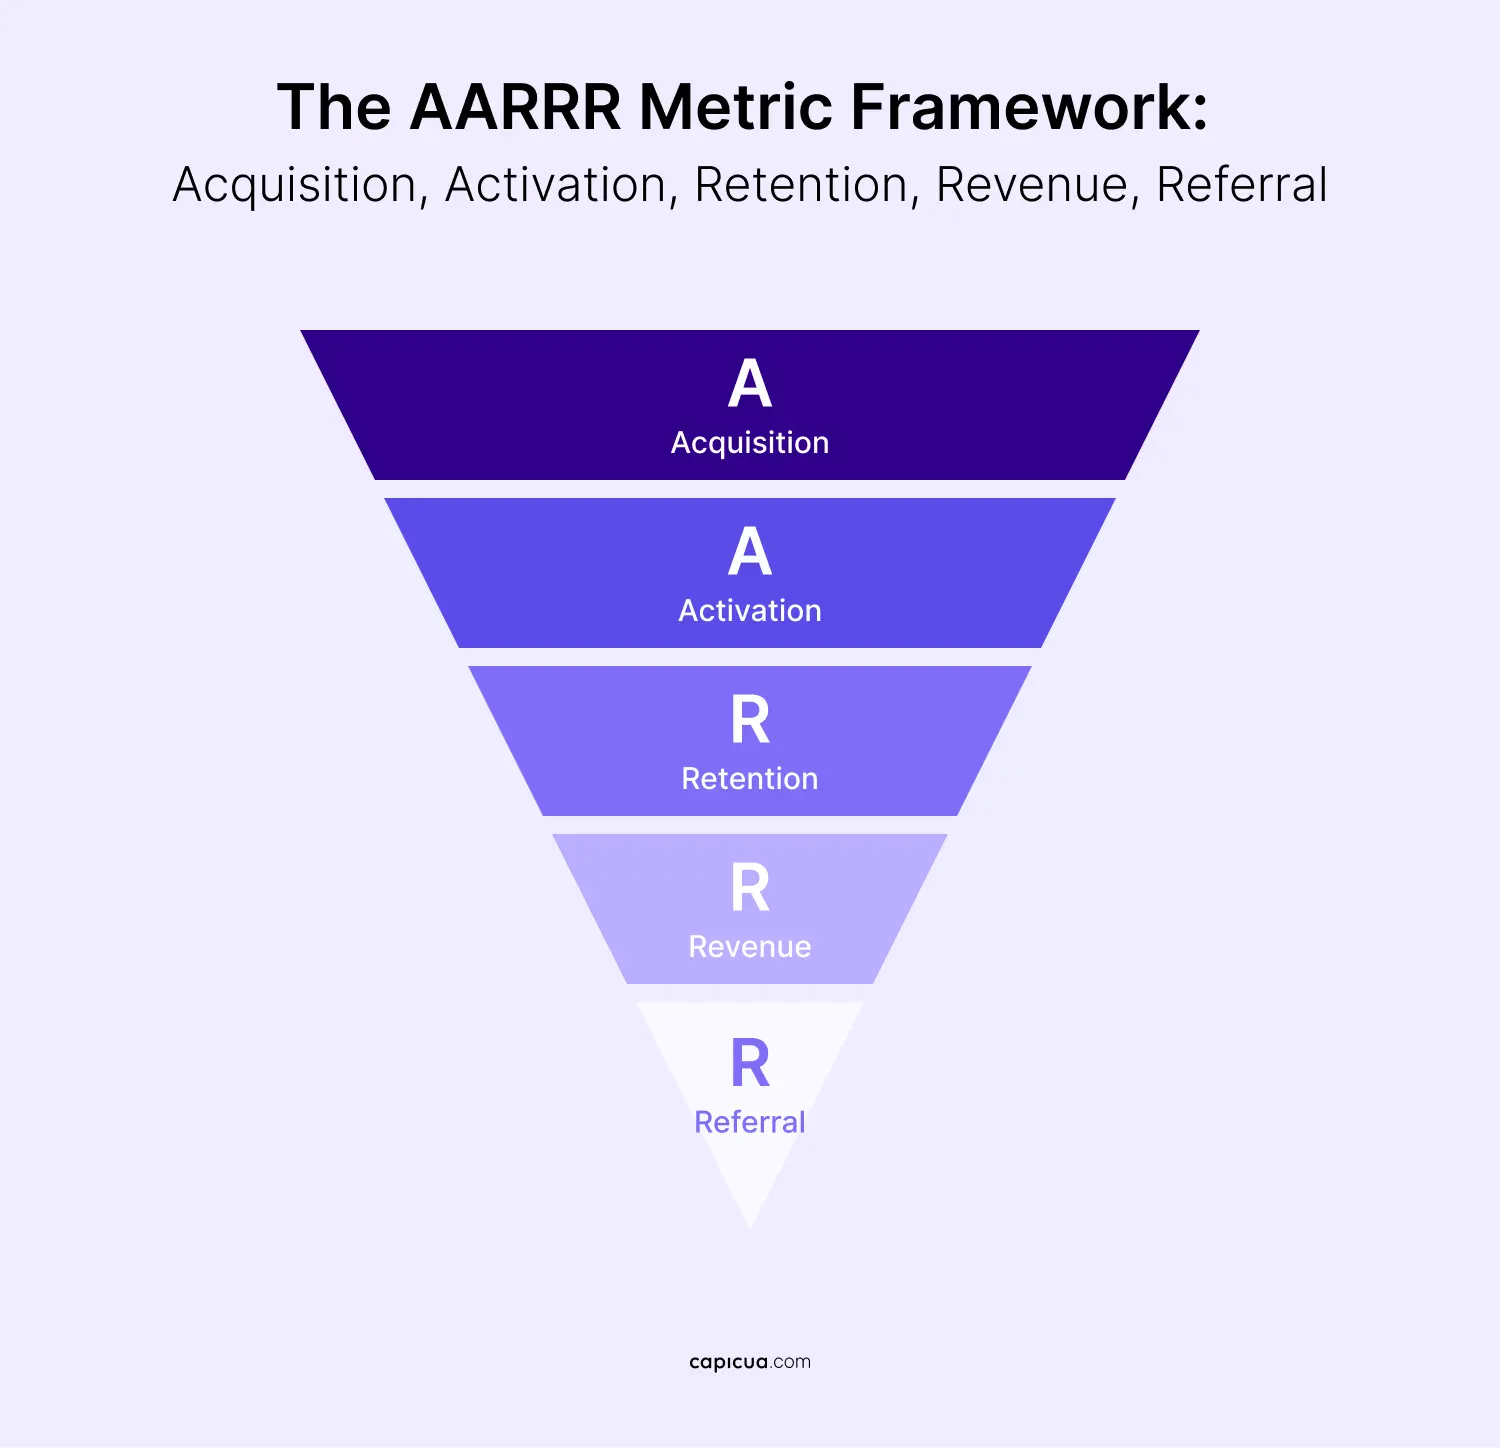
That is the problem the AARRR framework was built to solve. Also called pirate metrics because of how it sounds, AARRR is a growth model that maps the full customer lifecycle of a digital product into five measurable stages: Acquisition, Activation, Retention, Revenue, and Referral. Angel investor Dave McClure introduced it in 2007 to pull founders away from vanity metrics and toward "the five numbers that matter."
This guide breaks down how the AARRR metrics framework works for software and SaaS products specifically, which benchmarks matter at each stage, and how product leaders use it to turn scattered data into decisions.
What is the AARRR (Pirate Metrics) Framework?
The AARRR framework is a growth model that divides a digital product's customer lifecycle into five sequential, measurable stages: acquisition, activation, retention, revenue, and referral. Each stage answers one question about how users move through your product, and each carries a single metric worth tracking closely.
The name comes from how the acronym sounds read aloud, which is why practitioners call it "pirate metrics." McClure designed it after watching young companies get distracted by surface-level numbers like page views and follower counts, metrics that looked healthy while the business underneath stalled. The framework reorders attention around the moments where value and money change hands.
For software products, the five AARRR stages map cleanly onto the subscription lifecycle:
- Acquisition: how users first discover and sign up for your product.
- Activation: when a new user reaches their first real value moment (the "aha moment")
- Retention: whether users keep coming back and stay engaged over time.
- Revenue: how the product monetizes through subscriptions, upgrades, or usage.
- Referral: when existing users bring in new ones through invites and word of mouth.
Seventeen years after that first talk, AARRR remains one of the most widely used product growth frameworks in software because it stays simple on the surface while exposing deep patterns in user behavior.

Acquisition and in AARRR Metrics Framework
First, acquisition measures how efficiently you attract new users, typically tracked through customer acquisition cost and channel-level conversion rates. It's also the stage where economics has shifted the most. The median New CAC Ratio has risen to $2.00 in sales and marketing spend per $1.00 of new customer ARR, up 14% year over year, and the median CAC payback period has stretched over the past three years. Spending more on acquisition only compounds returns when the next stage holds.
Activation in AARRR Metrics Framework
Later on, activation is where most of that spend is won or lost, as it refers to the moment a new user first experiences the core value of your product, the aha moment that makes the tool feel worth keeping. More than 98% of new users churn within two weeks if they never hit a real value milestone, according to a report based on data from over 2,600 companies.
Since the median user activation rate across B2B SaaS sits in the 20%-35% range, while top-quartile products clear 40%, benchmarks give product leaders a way to grade their own funnel. The lever that separates the two is time-to-value: the fastest products deliver value in under five minutes, and speed-to-value is the strongest early predictor of whether a user stays. This is why onboarding design matters so much, a theme we cover in depth in our SaaS user onboarding best practices.

Retention in AARRR Metrics Framework
Retention measures whether users continue to return and engage after activation, and it’s the stage that most mature SaaS companies obsess over. The reason is that keeping an existing customer costs far less than winning a new one, and every retained user extends the payback window that acquisition stretched.
A useful benchmark is the 7% rule: if just 7% of the original user cohort returns on day 7, the product already ranks in the top quartile for user retention. Retention also validates the work done upstream. According to the Amplitude Product Benchmark Report, around 69% of products with strong early activation went on to become strong three-month retention performers, which confirms that activation and retention are two ends of the same lever.
For product leaders, retention connects experience to revenue. Sustainable SaaS growth depends on a base of users who stay long enough to expand, which is exactly the dynamic that product-led growth strategies are built to create. When retention slips, no amount of top-of-funnel spend fixes the underlying leak.

Referral in AARRR Metrics Framework
Referral closes the loop by turning satisfied users into an acquisition channel, which is why it lowers the CAC pressure described earlier. Between 20% and 40% of new SaaS customers already arrive through referrals and word of mouth, and referred customers have a 16% to 25% higher lifetime value and churn about 20% less. With 86% of buyers trusting recommendations over ads, a working referral loop can cut blended CAC by 25%-35%.
Revenue in AARRR Metrics Framework
Revenue measures how effectively the product converts engaged users into paying, expanding customers. In SaaS, the metric that matters most is Net Revenue Retention (NRR), which captures expansion, contraction, and churn inside your existing base. The median NRR across B2B SaaS is around 101%, and expansion revenue now accounts for roughly 40% of total new ARR. The strategic point is that an NRR above 100% means a company can grow revenue without acquiring new customers, because expansion outpaces churn.
Best-in-class products achieve 130% NRR, and for SaaS companies with ARR above $50M, expansion can account for more than 50% of new revenue. Products that reach this level almost always find and instrument their value moment early.

How to Implement the AARRR Metrics Framework
Adopting the pirate metrics well means tracking the right things at each stage. A practical rollout for a product team includes:
- Assign one north-star metric to each stage, so each has a number the team defends.
- Instrument the full funnel end-to-end so that a drop between two stages is visible.
- Find your biggest leak before optimizing anything, e.g., typically on activation.
- Run focused experiments and measure the downstream effect on the stages beneath it.
- Review the funnel by cohort over time to keep retention and expansion trends visible.
The mistake most product leaders make is pouring budget into customer acquisition while the real leak sits in activation. When 98% of unactivated users are gone within two weeks, buying more of them accelerates the loss. AARRR framework enforces fixing the stage that constrains the ones below it while treating vanity metrics.
A funnel full of metrics only helps when the whole team reads the same reality, and Shaped Clarity™ exists to turn scattered product signals into a shared, decision-ready view of where growth is won and lost. When AARRR becomes the lens through which a team plans, acquisition spend, activation work, and retention bets begin to compound. Learn more about Shaped Clarity here!
Conclusion
The lasting value of the AARRR framework is the shift in attention. By forcing a product team to name and measure acquisition, activation, retention, revenue, and referral as a single connected system, pirate metrics reveal that, most of the time, the problem is a matter of which stage is quietly constraining the rest. Map your five stages, find your leak, and let the numbers tell you where the next unit of effort belongs.
Turn your AARRR funnel into compounding SaaS growth: contact us or book a call.