


After four straight years of decline, Forrester's 2026 CX Index recorded the first year-over-year improvement in US CX quality since 2021, with 26% of the 225 brands measured in both years posting statistically significant gains and only 7% declining. The mirror image appeared a year earlier, when Forrester's global rankings found 25% of US brands sliding and just 7% improving across more than 275,000 customers and 469 brands.
The brands that moved found out what was happening in their product before their revenue told them, which is why customer experience research methods matter more than ever. Qualtrics XM Institute found that fewer than 1 in 3 consumers now give feedback to companies at all, an all-time low, while 34% quietly reduce spending after a bad experience and 13% stop entirely. Its Q3 2025 study of 20,001 consumers across 14 countries puts nearly $3 trillion in global sales at risk, including $973 billion in the US alone.
For post-PMF SaaS founders, the practical question is whether the UX research results reaching your roadmap are the kind you can bet a quarter of engineering capacity on, and whether your user experience research report ends in decisions or in a deck nobody reopens. This guide covers how to choose customer experience research methods by decision type, how to read the evidence honestly, what belongs in a user research report, and how to convert UX research recommendations into committed product bets.
What are Customer Experience Research Methods?
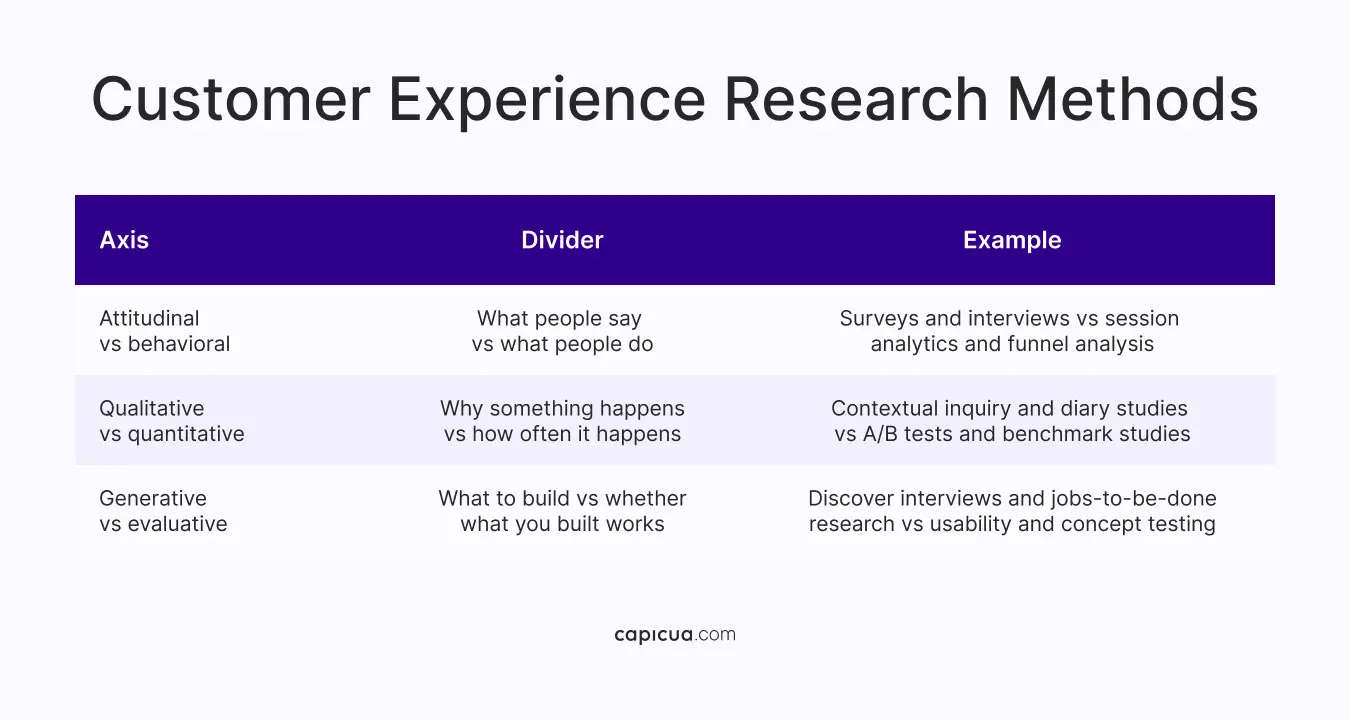
Customer experience research methods are the structured techniques teams use to collect evidence about how people discover, adopt, use, and abandon a product, so that product decisions rest on observed behavior instead of internal assumptions. These research methods span from the first pricing page visit to the renewal conversation, which is what separates them from usability testing alone. Every method sits on three axes, and knowing where a method sits tells you what it can and cannot prove:
That third axis (generative vs. evaluative research) is where most teams are unbalanced. In User Interviews' 2025 State of User Research report, evaluative research remained the most common type at 78%, discovery and generative research sat at 76%, and concept testing rose 6 points year over year to 64%. The median researcher shipped 2 mixed-methods, 3 qualitative, and 1 quantitative study over six months. Relying heavily on evaluation tells you if what you decided to build works, yet it rarely tells you whether you should have built it.
Triangulation is the counterweight to unbalanced research. Nielsen Norman Group describes mixed-methods research as combining qualitative and quantitative data so that each compensates for the other's blind spots, and the practical rule for product leaders is simple: no single study should be sufficient to justify a large bet. Analytics tell you where users drop, and interviews tell you why. A customer journey mapping exercise tells you which of those drops sits on the path to revenue. At Capicua, we treat the three as one evidence set rather than three separate deliverables, which is also how we structure product and UX discovery engagements.
How to Choose Customer Experience Research Methods
Choose the method based on the decision it must support, not the method your team is most comfortable running. In the User Interviews study, 87% said method choice was driven by the type of question they needed to answer, and 74% stated project timeline and speed as key factors, yet comfort with the technique ranked lower.
A reliable selection process takes five steps:
- Name the decision: "Whether to rebuild onboarding or instrument it first" is a decision. "Onboarding research" is a topic, and topics produce reports, not recommendations.
- State what would change your mind: Write the finding that would make you abandon the plan. If no finding could, the study is theater and the budget belongs elsewhere.
- Match evidence to decision risk: Reversible, low-cost decisions can run on 5 to 8 moderated sessions. Decisions that commit a quarter of engineering capacity need behavioral data plus qualitative explanation.
- Set the confidence threshold: Decide in advance what sample, effect size, or agreement level you will accept, so you can't renegotiate the result after you see it.
- Name the decision owner: A study without a named owner produces a user experience research report that circulates and expires.
Maze's Future of User Research Report 2026 found that reported research demand rose from roughly 55% to 66% of participants year over year. However, organizations where research is essential to all levels of business strategy nearly tripled, from 8% to 22%. The combination of more demand and flat capacity is the condition under which method selection becomes a resource allocation decision.
A useful discipline for post-PMF teams: run continuous product discovery at low volume rather than large studies at low frequency. Four short conversations a month with current customers, instrumented against the metrics in your UX metrics framework, will surface drift earlier than one heavyweight quarterly study that lands after the roadmap is locked.

What a User Experience Research Report Should Contain
A user experience research report is a decision document, structured so a reader who wasn't in the sessions can act on it without asking follow-up questions. The strongest reports open with the recommendation and let the evidence follow, because executives read for the decision and researchers read for the method, and that order serves both.
Eight components cover the job:
- Decision in question, written as the choice the team faces and the date it must be made.
- Recommendation, stated in one sentence at the top with a confidence level attached.
- Method and sample, including who was recruited, who was excluded, and why.
- Findings ranked by decision impact, not by how interesting they were to observe.
- Counter-evidence, listing what the study found that argues against the recommendation.
- Confidence and limitations, naming what this study cannot tell you.
- UX research recommendations, each with an owner, a scope, and an effort estimate.
- Instrumentation plan, defining the metric that will confirm or falsify the recommendation.
Component five (counter-evidence) is the one most often dropped, yet the one that earns the most trust. A user research report that presents only confirming evidence teaches stakeholders to discount the next one.
Reports go to die in storage. Maze found 61% of organizations provide research tools and templates to non-researchers, 49% maintain research libraries or repositories, 46% run training workshops, and 13% offer no supporting resources at all. A research repository with consistent tagging turns a one-off study into a reusable asset, and it's the difference between answering "have we researched this before" in two minutes and re-running a study you already paid for. That reuse compounds when reports are linked to the customer journey maps and product experience strategy they inform.

How to Read UX Research Results
Read UX research results by establishing what kind of evidence they are before you look at what they say. Sample size, method, and framing shape the number more than the number shapes the truth, and product leaders who skip that step end up confidently wrong at scale. Three checks catch most misreadings:
- Instrument: Human Factors reviewed 87 experimental studies published between 2001 and 2025 and found the field leans on performance measures in 19% of studies, NASA-TLX in 12%, and eye fixations in 11%. Because these instruments don't measure the same construct, two teams can test the same flow and reach opposite conclusions.
- Behavior: A Computers in Human Behavior report examined 624 UK gambling sites and found 86% used at least one dark pattern, 47% hid the reject option, and 24% offered no reject. High consent rates looked like product-market fit and were an artifact of layout.
- Baseline: Baymard's checkout UX research rates 64% of desktop and 63% of mobile checkout experiences as mediocre or worse and estimates that checkout design alone can lift conversion by up to 35%.

How to Turn UX Research Recommendations Into Product Decisions
Convert UX research recommendations into decisions by giving every recommendation a status, an owner, and a review date, then recording the outcome, whether or not you followed it. Maze reports 41% of organizations now let research inform both product and strategic decisions, and the share where research is essential to all levels of strategy climbed from 8% to 22% in a single year, with nearly 35% of researchers describing their role as becoming more strategic.
In the User Interviews study, 83% of researchers measure their impact qualitatively, 54% do not track impact numerically at all, and only 21% of those who do track it are satisfied with how they do it. Separately, 52% said ROI expectations do not influence what research they prioritize. A function that cannot demonstrate its effect on revenue or rework is the first line item questioned when budgets tighten, which is precisely what the market saw when 21% of respondents reported researcher layoffs at their company.
A decision log fixes most of this without new tooling:
- Recommendation: The specific change proposed, in one sentence.
- Status: Committed, deferred, or rejected, with the reason.
- Owner and date: Who decided, and when the decision gets revisited.
- Outcome metric: The number that moved, or did not, after shipping.
Reviewed quarterly, the log answers the question every board eventually asks: what did research change, and what did it save. It also surfaces the pattern worth acting on: recommendations deferred repeatedly that later arrived as an incident, a churn spike, or a rebuild. Teams operating a mature product operating model treat that log as a first-class artifact rather than a retrospective exercise.

How to Scale Customer Experience Research
Scale customer experience research methods by distributing execution and centralizing judgment. Research is already leaving the research team: Maze found product managers running research at 39% of organizations, market researchers at 35%, and marketers at 23%. Treated as a governance problem rather than a turf problem, that distribution is capacity you already have.
AI has also absorbed much of the mechanical work, with Maze reporting that 69% of participants now use AI in at least some research projects, a 19% increase year over year, with the top reported benefits being improved turnaround time at 63%, improved team efficiency at 60%, and optimized workflows at 56%. The same respondents drew a clear boundary around judgment: 82% said interpreting nuance and emotion still requires humans, 80% said ethical decision-making does, 76% said framing the right research questions does, and 66% said making strategic recommendations does.
Skepticism is healthy here, since AI use among researchers reached 80%, up 24 points year over year, while 91% worry about output accuracy and hallucinations and 63% fear AI could devalue human insight and critical thinking. The pattern matches Google Cloud's DORA research findings, summarized in its own words: "AI doesn't fix a team; it amplifies what's already there." Three controls keep quality intact as volume rises:
- A shared method library that states which customer experience research methods are approved for which decision types.
- A review gate where a researcher signs off on study design and on synthesis, leaving execution distributed.
- A single research repository with one tagging scheme, so distributed studies accumulate into evidence instead of scattering across tools.
Most of the failures above share the same root cause: teams collect evidence faster than they convert it into committed decisions, so UX research results pile up while the roadmap keeps running on assumptions. Shaped Clarity™, Capicua's operating lens, closes that distance by connecting what users actually do to the product bets a company commits to next. Products adapt as the market moves because the learning loop is part of the operating model, which is what turns a user experience research report into a decision the team can stand behind. Learn more about Shaped Clarity.
Conclusion
The brands that reversed their CX decline shortened the distance between what customers were telling them and what the product team committed to build. Customer experience research methods create the evidence, a disciplined user research report makes it legible, and a decision log makes it accountable. If you skip any of the three, the research budget becomes a cost center nobody can defend.
To build a research practice that produces decisions instead of documents, get in touch with Capicua: contact us or book a call.