A value stream map makes the path that slows teams down in a single view, with real numbers attached to every step and every gap between steps. Today, most of a feature's calendar time is spent outside the act of writing code: the discovery that never happened, the spec that arrived half-formed, or the pull request that sat for six days. Teams have never produced code faster, yet delivery has never felt slower, and those investing in AI code generation are seeing only a 3% increase in productivity against promises of 100% to 200%.
The familiar levers have stopped returning much: hiring adds coordination cost, yet more ceremony adds overhead. Value mapping treats delivery as a system, measures where calendar time goes, and identifies the single queue whose removal changes the entire curve. This guide covers what a value stream is, how to build a value map for a digital product, how value stream management extends the practice, and which mistakes are most costly.

What is a Value Stream in Software Development?
A value stream is the complete sequence of activities an organization performs to turn a customer need into a delivered outcome, including every handoff, approval, and queue along the way. In software and digital products, the sequence starts when a signal enters the organization and ends when a user changes behavior because of what shipped.
There are three differences between a value stream and a workflow diagram:
- Crossed functions: A value stream ignores org-chart boundaries and follows the work through product, design, engineering, QA, security, and go-to-market. Most of the delay lives at the seams between groups rather than inside any one of them.
- Two kinds of time: Process time is the interval when someone is actively advancing the work, and wait time is the interval during which the work exists and no one is working on it. Most teams track the first yet rarely measure the second kind of time.
- Outcome vs deploy: A deployment nobody adopts consumes capacity without producing value, so anchoring the stream on user behavior keeps the map honest about what "done" means, which connects directly to continuous product and UX discovery.
In a survey of 340 engineering professionals, only 27% said both the problem and the success criteria were clear when they read a ticket, and 60% needed clarifying questions "often" or "almost always" before starting. Ambiguity entering the stream becomes rework.
What is a Value Stream Map?
A value stream map is a to-scale diagram of every step between a customer request and the delivered outcome, showing how long each step takes and how long work spends waiting between steps. Value stream mapping is the exercise of building this diagram with the people who do the work, using observed data rather than beliefs. A value map is the artifact; value mapping is the activity; and value stream mapping is the formal method, borrowed from lean manufacturing and adapted for knowledge work.
A completed map surfaces four things dashboards typically hide:
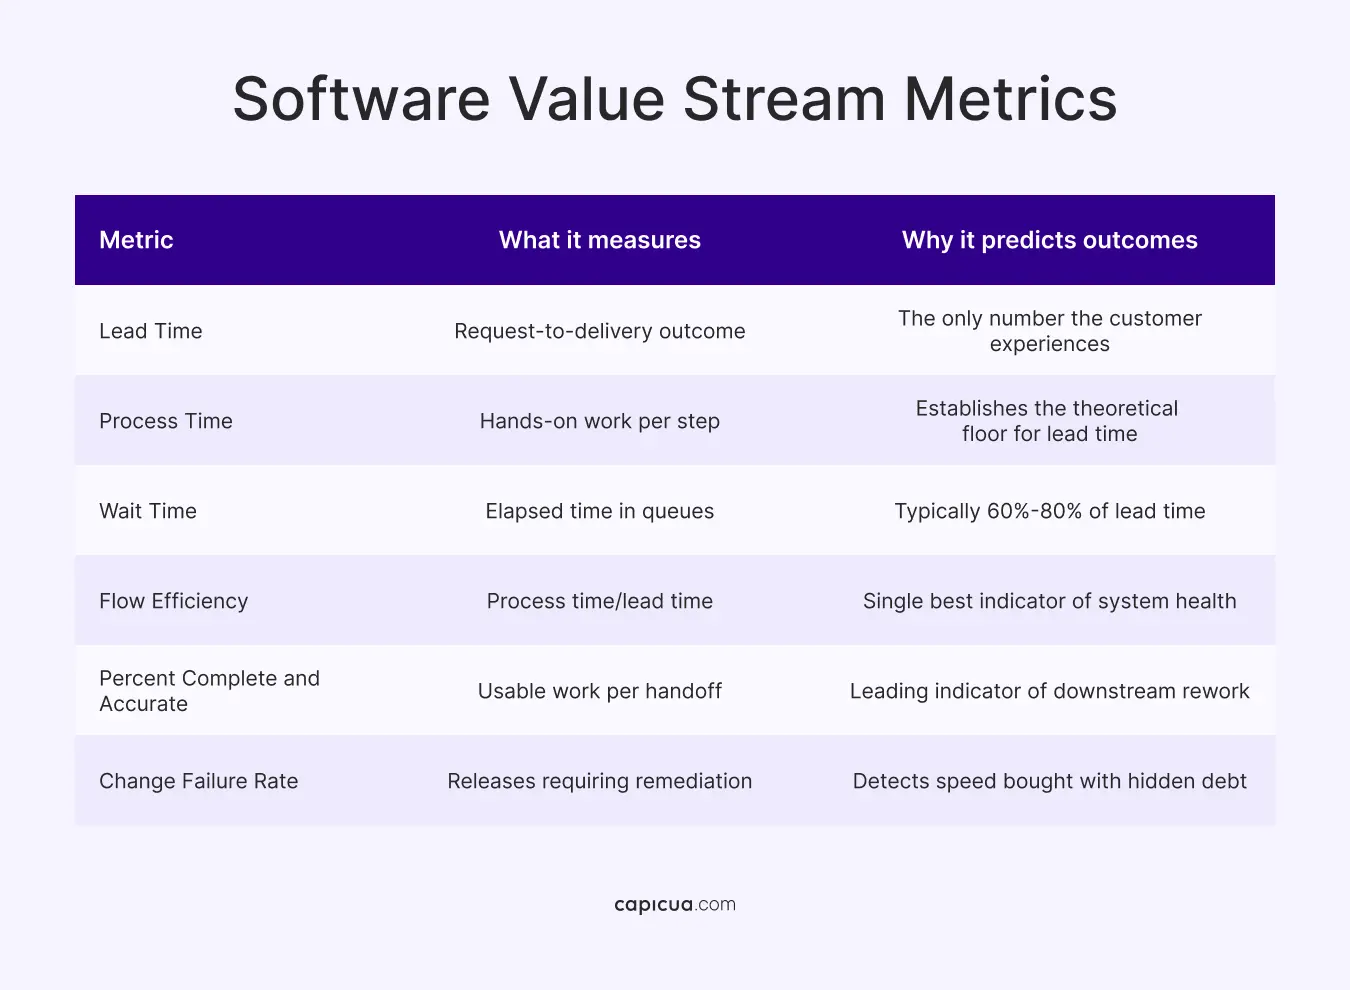
- Flow efficiency: Process time divided by total lead time. Most software value streams land between 15% and 40%, meaning the majority of a feature's life is spent waiting.
- Actual constraints: Every value stream has one step that governs throughput, and improvements elsewhere yield only local speed without system change. Value stream analysis locates constraints in review, verification, or approval.
- Rework loops: Missing acceptance criteria drive 50% of delays and late-discovered edge cases drive 40%, according to Refactoring.
- Decision latency: The interval between a question being raised and a decision being made is usually the largest uncounted queue in a product organization.
McKinsey reports that traditional continuous integration and delivery automation "can be as much as 30% of total technology spend", while the majority of effort, concentrated in requirements through coding, "remains manual and interpretation heavy." Leaving decision latency unmapped becomes more expensive over time.
How To Build a Value Stream Map for a Digital Product?
A value stream map is built in sessions with the people who perform each step, walking the work backward from the customer to the origin of the request, and attaching observed time data to every box and every gap. The exercise takes half a day for a single stream and produces a current state map, a future state map, and a list of changes worth making.
- Define the stream and trigger: Pick one product area and one work type. A bug-fix stream and a net-new-feature stream behave differently, and averaging them produces a map that describes neither.
- Walk the process backward: Start at the customer outcome and ask each participant what they receive and from whom. Working backward exposes handoffs.
- Record process time and wait time separately: For each step, capture hands-on hours and elapsed calendar days. The difference between those two numbers is the finding.
- Add percent complete and accurate: Ask each receiving function what share of incoming work is usable without clarification. Anything below 80% signals rework loops.
- Compute lead time and flow efficiency: Total the timeline and divide process time by lead time. Teams that skip this debate priorities, not constraints.
- Design the future state around one constraint: Target the largest queue, define the mechanism that removes it, such as a review service-level agreement, a smaller batch size, or an earlier decision gate, and model the resulting lead time.
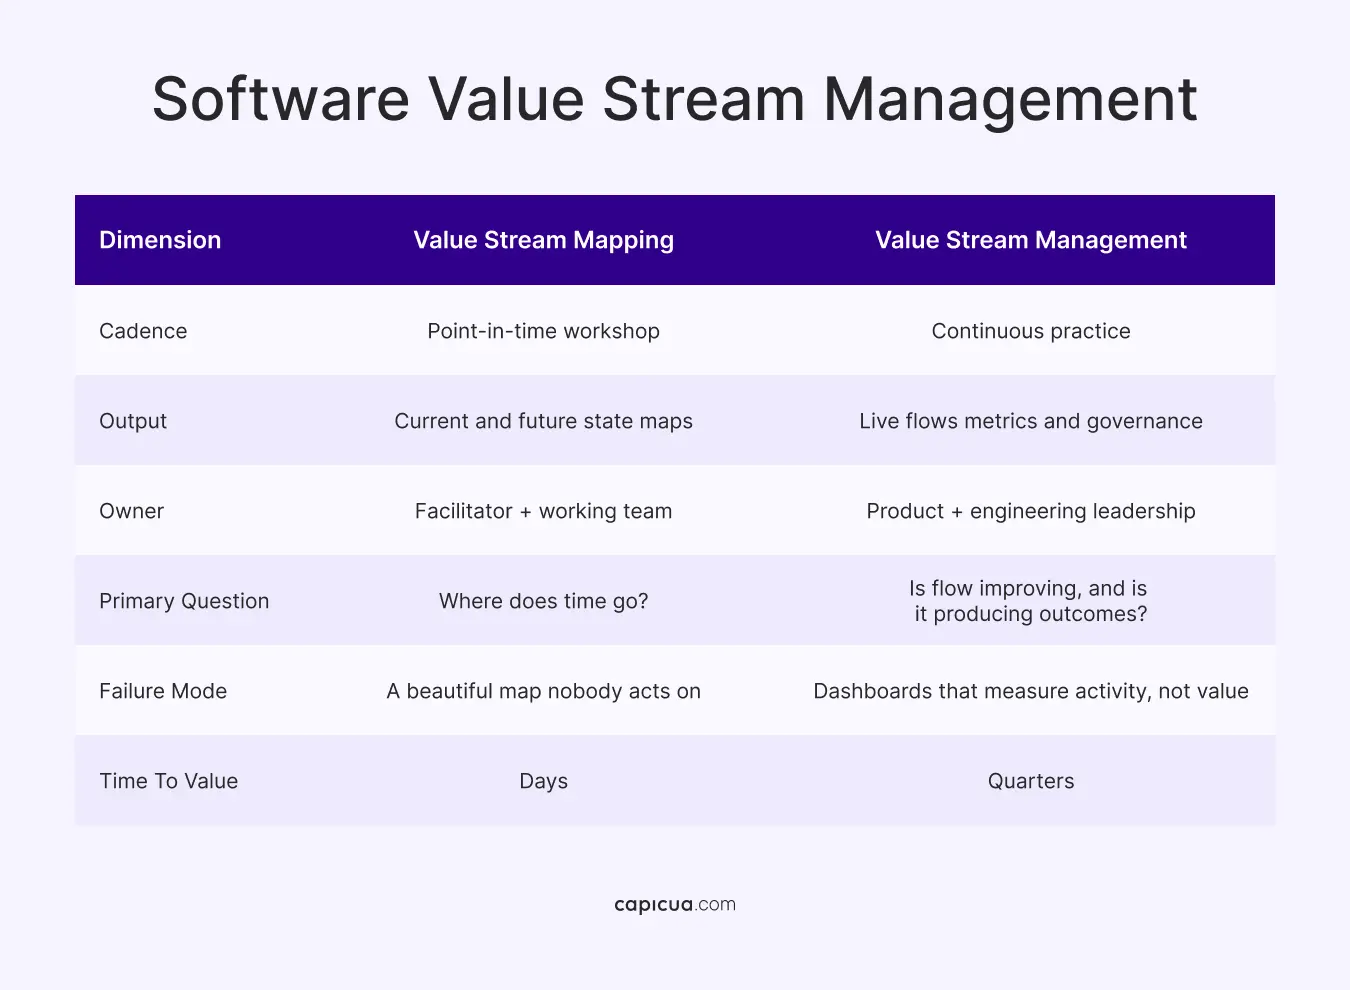
- Instrument and re-map on a cadence: A value map is a snapshot. Re-running it quarterly turns value mapping into value stream management.
Step 6 (design the future state around one constraint) is where most maps fail commercially because a future state requiring six simultaneous changes will not survive contact with a roadmap. A future state that removes one queue and proves a lead time reduction earns the mandate for the next one.

What is Value Stream Management?
Value stream management is the ongoing practice of measuring, governing, and improving the flow of work through a value stream, using the map as its baseline and flow metrics as its instrumentation. Mapping is an event; management is an operating discipline that runs continuously and ties delivery data to business outcomes.
DORA's 2025 research found that 90% of organizations have adopted at least one internal platform, and identified a direct correlation between high-quality internal platforms and an organization's ability to unlock value from AI. Platforms generate telemetry, and value stream management supplies the question that telemetry should answer.
Teams that buy a value stream management tool before running a value stream mapping exercise instrument the process they assume they have. The map tells them which measurements are worth automating.
Value Stream Metrics To Predict Delivery Outcomes
The metrics worth tracking for a value stream describe flow rather than effort: lead time, process time, wait time, flow efficiency, percent complete and accurate, and rework rate. Velocity, story points, and commit counts describe activity inside the system and move independently of what customers receive.
"Change failure rate" is where the current cycle is breaking. The 2026 State of Software Delivery Report found main branch success rates fell to 70.8%, the lowest in five years, while median recovery time rose 13% to 72 minutes. Nearly three out of ten production merge attempts now fail, throughput and stability have decoupled, and only a value stream map shows which of the two a given change is buying.
The same report found that average daily workflow runs increased by 59% year over year, while the median team saw a 4% increase and the bottom quartile saw none. The average is carried by the top 5%, who nearly doubled throughput. Aggregate industry numbers now describe almost nobody, which raises the value of measuring your own value stream over benchmarking against a mean.
Value Stream Mapping in the Agentic AI Era
Value stream mapping matters more now because AI raises the input rate to a delivery system without widening any of its downstream gates, converting latent queues into visible backlogs. When generation accelerates, and validation does not, the constraint grows.
DORA's 2025 report found that 90% of respondents use AI at work and more than 80% believe it has increased their productivity, while AI adoption remains negatively associated with software delivery stability. Speed at the keyboard is real, but stability at the boundary is where it gets spent.
McKinsey projects that agentic delivery models can produce "threefold to fivefold improvements in productivity, with a 60 percent reduction in team size", with pipelines running end to end in hours and humans intervening at defined review gates. Those gates are value stream design decisions, and choosing where a human belongs in an otherwise automated stream requires a map of the stream.
If AI amplifies what a delivery system already does, the return on AI investment is a function of system quality rather than tool selection. Two companies buying identical tooling will diverge based on how much waiting was already embedded in their value stream, the same logic that governs whether a digital product growth strategy compounds or dissipates.

Common Value Stream Mapping Mistakes for Product Teams
Value stream mapping mistakes share a root cause: the map is built as a documentation exercise, not a decision-making one. Five patterns account for most of the wasted effort:
- Mapping the idealized process: Teams map the workflow described in the handbook rather than the one that ran last quarter. The correction is to walk three real work items through the stream and record what happened to each.
- Measuring process time only: A map without wait time reports that everything is fine and explains nothing. Wait time is typically 60% to 85% of lead time, and it's where every meaningful improvement lives.
- Starting the stream at the ticket: Beginning at "story is refined" hides the queue between a customer signal and a committed decision. 59% of teams discover missing tasks or dependencies mid-sprint, and 35% name unclear or changing specifications as their primary slowdown: the upstream portion deserves the most attention.
- Optimizing everywhere at once: A future state with a dozen changes is a wish list; a future state with one change and a modeled lead time is a plan a board will fund.
- Leaving the map in a room: 64% of teams store critical knowledge in people's heads, and a map living as a whiteboard photo joins that category within a month. Instrumenting two or three of its metrics turns value mapping into value stream management.
Some teams map the stream, identify the constraint and then add capacity to the constrained step rather than removing the queue in front of it. Adding reviewers without changing the batch size or review policy usually lengthens the queue because greater review capacity invites larger pull requests.
A value stream map is one expression of the Shaped Clarity™, a shared operating reality that lets product, design, and engineering argue from evidence. When the queues are visible, prioritization becomes a calculation, and scaling teams stop paying for the same feature twice. Start leveraging Shaped Clarity today.
Conclusion
Value stream mapping gives founders and product leaders a measured account of where a quarter actually goes. Most of a feature's life is spent waiting, the largest queue sits upstream of engineering, and the fastest available improvement requires no new headcount. Code generation has become abundant and validation has become the constraint, so teams that compound can see their own value stream clearly enough to change it deliberately.
Shorten the distance between decision and delivery: contact us or book a call.