


80% of features in the average software product are rarely or never used, while just 12% of features drive 80% of daily usage. Publicly traded cloud companies poured an estimated $29.5B into building features that ultimately delivered almost no value. Leaders who have already passed the product-market fit stage can agree that this is no abstract waste, as seen in bloated roadmaps, frustrated engineers, and flattening retention curves.
The Kano Model closes this gap by reframing prioritization around a single question that velocity-driven roadmaps tend to skip: how does each feature actually move customer satisfaction? This guide walks through what the Kano Model is, how to run a Kano analysis, a worked Kano model example, and a reusable Kano model template your team can apply this quarter. The goal is a roadmap built on signal, where accuracy, functionality, and intuitiveness are designed in rather than discovered after launch.

What is the Kano Model in Product Management?
The Kano Model is a feature prioritization framework that classifies product features by their impact on customer satisfaction and not effort or stakeholder preferences. Developed in the 1980s by Professor Noriaki Kano in his foundational paper "Attractive Quality and Must-Be Quality," its central insight is that the relationship between investment and satisfaction is nonlinear, and treating it as linear produces bloated, undifferentiated products.
Kano analysis sorts features into five categories:
- Must-Be: These features are the bare minimum expectations customers expect from a product. If present, users do not feel extra satisfaction, yet if they're missing or broken, they cause extreme dissatisfaction.
- Unidimensional: Also called the Performance category, these features have a direct relationship with customer satisfaction. The better the product performs here, the happier the customer is. Poor performance will also lead to proportional dissatisfaction.
- Delighters: These are unexpected, pleasant surprises that the customer did not explicitly request. Their presence generates immense joy, delight, and customer loyalty; however, since they are not expected, their absence does not cause any dissatisfaction.
- Indifferent: These features hold no real emotional value for the customer. Users don't care whether these features are present, so their satisfaction level remains unchanged.
- Reverse: The presence of these features elicits a negative reaction and actively pushes customers away, meaning their absence leads to higher satisfaction.
It's important to note that most workflows operate with three main types within the Kano Model's five categories: Must-Be, Unidimensional, and Delighted.

How the Kano Analysis Model Works
A Kano analysis asks customers two questions about every candidate feature: a functional question (how would you feel if the product had this feature?) and a dysfunctional question (how would you feel if it did not?). Each is answered on a five-point scale from "I like it" to "I dislike it." The pair of answers maps each feature to a Kano category.
Running the Kano analysis model follows a clear sequence:
- List: List candidate features from your backlog, support tickets, and discovery research.
- Write: Use neutral language to annotate the question pair for each feature.
- Survey: Interview a representative segment of your actual users.
- Map: Connect each response pair to a category with the standard Kano evaluation table.
- Prioritize: Build the roadmap around the dominant category for each feature.
As you may have guessed, Kano results are not permanent. Today's delighter becomes tomorrow's must-be as the market normalizes it. This drift is why product discovery must be continuous, translating user signals into ongoing product decisions.

The Kano Model Categories Explained
A Kano model example can make the categories concrete. Imagine a B2B analytics platform scoping its next release. For this example, we'll focus on the most-used categories (Must-Be, Unidimensional, and Delighted) to sort the work into very different priorities.
- Must-Be: Role-based access control. Enterprise buyers assume granular permissions exist. Shipping them earns no praise, but their absence ends deals. These features get built quietly and reliably.
- Unidimensional: Dashboard load time. Every second shaved off load time measurably lifts satisfaction. This is where the platform competes head-to-head, and where investment scales with returns.
- Delighter: Natural-language query. Letting a user type "show me churn by cohort last quarter" and get an instant chart is unexpected. It differentiates and creates advocacy, but only after the must-be and performance tiers are solid.
A widely cited Kano allocation guideline, summarized by Product School, suggests allocating roughly 60% of resources to basic needs, 30% to performance, and 10% to delight experiments. The ratio is a starting point, not a rule, but it anchors teams against the temptation to chase novelty before the fundamentals are in place.
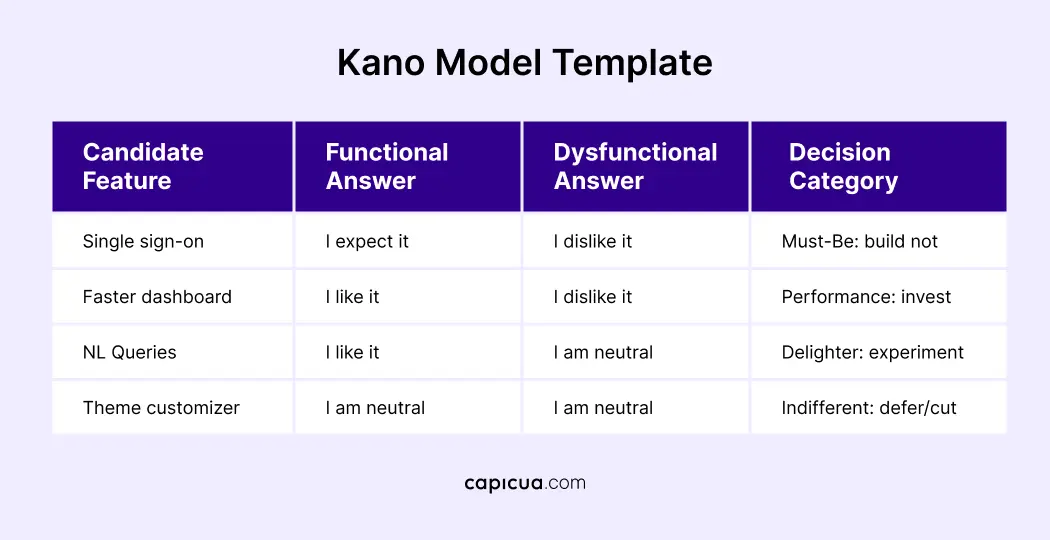
Kano Model Template and Kano Feature Categorizer
The Kano model template gives your team a repeatable structure. For each feature, capture the question pair, survey the result, and record the category and decision. Pair this template with a structured scoring layer when you need to sequence within a category. Capicua's guide to feature prioritization for sustainable product evolution pairs Kano categories with RICE scoring, allowing two equally "must-be" features to be still ranked by reach, impact, confidence, and effort. You can also work with our interactive Kano Feature Categorizer to make sure where to start!
How Kano Analysis Improves Accuracy and Intuitiveness
The Kano Model's greatest value lies in how it strengthens three qualities that determine whether a product earns retention: accuracy, functionality, and intuitiveness.
Accuracy improves because Kano replaces stakeholder assumptions with validated user signals. According to a Code Climate analysis cited by ProdPad, 30 to 50% of engineering effort goes toward avoidable rework due to misaligned requirements. Categorizing features before they reach the roadmap reduces that misalignment at the source.
Functionality sharpens because the must-be tier forces teams to make the fundamentals genuinely reliable before investing in novelty—a delighter built on a shaky basic feature will delight no one.
Intuitiveness benefits because Kano keeps the surface area disciplined. When 80% of features go unused, the unused ones still add cognitive load. Cutting indifferent features makes the product easier to understand, which is itself a form of design.
A Kano analysis only changes outcomes when its signals feed a shared operating reality. Shaped Clarity™, Capicua's lens, turns those signals into business breakthroughs, keeping the roadmap aligned with what users value as the market and the categories shift over time.
Conclusion
The Kano Model answers the question that velocity-obsessed roadmaps avoid: not how much we can build, but how each feature moves the people who use it. And that distinction is the difference between a product that compounds loyalty and one that accumulates complexity.
Get in touch with Capicua to run the analysis, sort the backlog, and protect the capacity to build what genuinely delights: contact us | send us an email | book a call.