


While 90% of technology professionals now use AI at work, DORA's research found that higher AI adoption correlated with both rising software throughput and delivery instability, resulting in teams shipping faster systems they understand less well. This combination is the entire business case for predictive maintenance AI in software. The AI-driven predictive maintenance market reached USD 1.77 billion in 2025 and is projected to reach USD 19.27 billion by 2032 at a 39.5% CAGR, with software accounting for 74% of category spend. AI maintenance became an operating discipline for anyone running a platform at scale.
Your engineering org has a fixed capacity, and every hour spent on an incident that a model could have flagged three days earlier is an hour subtracted from the roadmap you promised the board. This guide covers what AI in predictive maintenance means for software founders, what reactive operations cost in real numbers, the five-stage maturity model, and the metrics that separate a working system from an expensive dashboard.

What is Predictive Maintenance AI in Software Products
Predictive maintenance AI is the use of machine learning models on telemetry, logs, traces, deployment history, and user behavior data to forecast where a digital product will fail before it fails, and to route that forecast to a human or an agent who can act on it. Applied to software, it replaces threshold alerts that fire on symptoms with probabilistic models that fire on trajectories.
Software degradation is rarely binary, and none of its indicators trigger a static threshold until they become an incident; think of a memory leak that grows by 3% per deploy, a query plan that quietly regresses after a schema change, a third-party API whose p99 latency has drifted by 40 milliseconds over six weeks. Predictive maintenance using AI treats drifts as the signal and not the noise.
There are three families of models doing most of the work in production today:
- Anomaly detection for multivariate time series that learns each service's normal operating envelope and flags deviations without a human-set threshold.
- Failure forecasting for survival analysis or gradient-boosted models on historical incident data to estimate the probability that a given component fails inside a defined window.
- Change-risk scoring to evaluate a pull request or deployment against the historical failure profile of the files, services, and authors it touches.
Gartner predicts that 40% of organizations deploying AI will use dedicated AI observability tooling by 2028, driven more by executive concern about risk in complex models than by infrastructure teams seeking efficiency. The board's demand changes how product leaders should frame the investment.
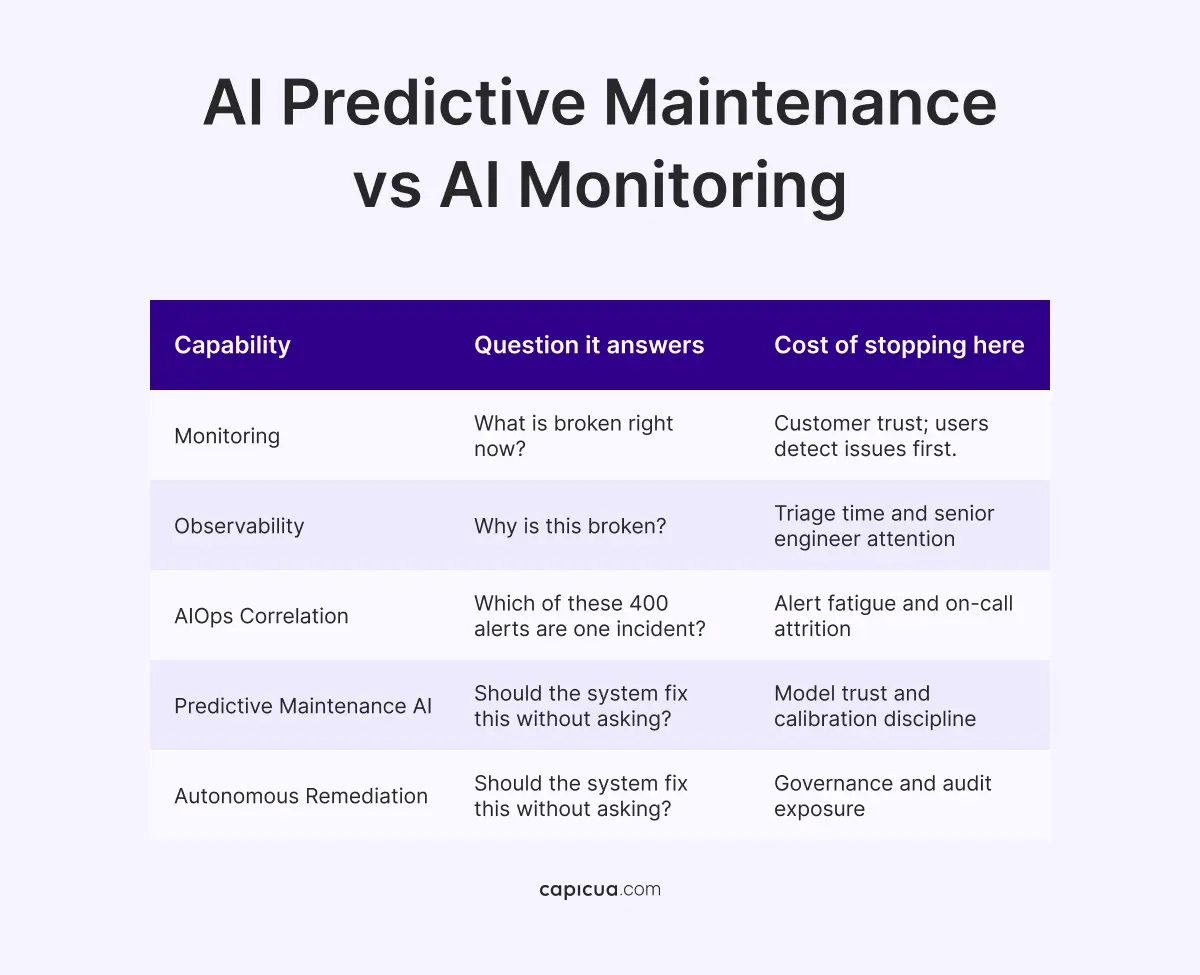
AI Predictive Maintenance vs AI Monitoring
While AI monitoring reports state, AI for predictive maintenance estimates trajectory. The questions that AI monitoring answers are in the realm of "is the error rate above 2% right now?" AI Predictive systems' answers focus on "given the last fourteen days of behavior, what is the probability this service breaches its SLO in the next seventy-two hours, and which change introduced the drift?" The gap between those two questions is where most engineering capacity leaks. A useful way to see it is by the question each maturity stage lets you ask: prediction quality is capped by the signal quality underneath it.
Gartner projects that 60% of enterprises will deploy agentic AI for IT infrastructure operations by 2029, up from under 10% today, and that the share of AI-suggested actions requiring human approval will fall from 80% in 2025 to 20% by 2029. The same forecast carries a warning worth reading twice: 40% of infrastructure and operations organizations deploying agentic operations at scale are expected to experience a business-critical service disruption by 2028, against under 1% in 2026.
What Does Reactive Software Maintenance Cost a Scaling Team
Reactive maintenance costs a scaling SaaS company two things simultaneously: direct revenue during degradation, and the compounding opportunity cost of engineering capacity that never reaches the roadmap.
Uptime Institute's Annual Outage Analysis 2026 found that 57% of respondents reported their most recent major outage cost more than USD 100,000, and one in five reported costs above USD 1 million for the second consecutive year. One in ten described their last outage as having a serious or severe impact, and two-thirds of reported outages involved third-party providers, meaning a meaningful share of your reliability profile lies in systems you do not control and cannot instrument.
The second cost is larger and rarely appears on a Profit & Loss Statement. Consider a 40-engineer product org at a fully loaded USD 145,000 per head, losing 32% of capacity to unplanned work. That's USD 1.86 million a year in engineering time spent on failures that already happened. Add six severity-one or severity-two incidents per month, with a 4.5-hour mean time to resolution and USD 9,000 per hour of exposed revenue, and the total annual cost of reactive operations exceeds USD 4.7 million.
Three structural forces are pushing that number up rather than down:
- AI-assisted development increases change velocity faster than it increases change confidence. DORA found that over 80% of practitioners report productivity gains from AI, while 30% report little to no trust in AI code. More changes, yet less certainty per change.
- Reliability gains from traditional engineering are flattening. Outage rates per site have declined for five consecutive years, which means the cheap wins are largely spent.
- AI features create a new incident class. Gartner expects that at least 50% of enterprise incident response efforts will be devoted to security issues related to custom-built AI applications by 2028.
Capicua describes the accumulation dynamic of this organizational debt: small, unaddressed degradations set the tolerance level for the next one, until firefighting becomes the culture rather than the exception.

What Does an AI for Predictive Maintenance Stack Include
An AI for predictive maintenance stack for digital products has five layers, and each one is a prerequisite for the layer above it. Skipping a layer produces confident predictions built on incoherent data, which is worse than no prediction at all.
- Signal layer: Unified telemetry across metrics, logs, traces, and events, plus deployment metadata and analytics. Models learn from labels, and inconsistent severity labeling is the most common reason predictive maintenance using AI underperforms.
- Correlation layer: Topology-aware grouping that collapses hundreds of alerts into a single probable incident, with a ranked cause list. An example of AIOps, here is where most teams get their first credible return.
- Prediction layer: Service-level anomaly detection, failure-window forecasting on components with incident history, and change-risk scoring on every deploy.
- Action layer: Routing, runbook suggestion, and bounded automated remediation; restart, roll back, scale, reroute traffic, feature-flag off.
- Governance layer: Model performance monitoring, false-positive and false-negative budgets, an audit trail for every automated action, and a documented escalation path.
For products with significant legacy surface area, the sequencing question overlaps with the modernization strategy, which Capicua addresses in AI-driven legacy modernization. Where this becomes an ongoing operating capability rather than a project, it belongs with TechOps

How to Roll Out Predictive Maintenance AI Without Adding Risk
Roll out predictive maintenance AI in four bounded phases, each with an exit criterion that has to be met before the next phase starts. The discipline here is to refuse to expand scope until the current phase produces trustworthy output, because a predictive system that cries wolf gets ignored within two sprints and is very hard to reintroduce.
- Phase 1 - Establish signal integrity (weeks 1-6): Pick the two or three services responsible for the majority of your volume. Instrument them consistently, assign a single accountable owner per service, and retroactively normalize your incident taxonomy. Exit criterion: every severity-one and severity-two incident in the last two quarters has a consistent label, an owner, and a timestamped timeline.
- Phase 2 - Prove correlation before prediction (weeks 6-12): Deploy alert correlation and measure the compression ratio and false-grouping rate. Exit criterion: alert volume per incident drops by half or better, with groupings matching reality.
- Phase 3 - Introduce prediction in advisory mode (weeks 12-24): Run anomaly detection and change-risk scoring in shadow mode, where models produce predictions that nobody is required to act on, and score them weekly against what actually happened. Exit criterion: precision and recall on your defined failure window are good enough that the on-call rotation asks to keep the signal.
- Phase 4 - Grant bounded autonomy (month 6 onward): Automate a small, explicitly listed set of low-blast-radius actions with mandatory audit logging and a documented rollback. Expand the list only after each action class has run cleanly for a full quarter. Exit criterion: every automated action is attributable, reversible, and reviewed.
The first failure mode is treating model output as ground truth: DORA's finding that AI functions primarily as an amplifier of existing organizational strengths and weaknesses applies here directly, and a team with unclear ownership will get faster, more confident versions of its existing confusion. The second failure mode is under-resourcing the governance layer; the gap relative to Gartner's expectation that 40% of organizations running agentic operations at scale will experience a business-critical disruption by 2028.

AI Maintenance Metrics To Prove Investments Work
The metrics that prove AI maintenance is working measure prevention, not response speed. A faster mean time to resolution is a real improvement, and it is also the metric a reactive organization optimizes when it has given up on prevention. Track six numbers instead.
- Predicted-to-prevented ratio: Of the failure predictions your models produced, what share led to an intervention that stopped a customer-visible incident?
- Prediction lead time: Median hours between a model's warning and the failure window it named.
- Unplanned work as a share of capacity: The single best proxy for whether prevention is compounding.
- Alert-to-incident compression: Alerts per real incident; a healthy correlation layer moves this from dozens toward low single digits.
- False-positive budget consumption: Set an explicit tolerance and track against it. Exceeding the budget erodes trust faster than missed predictions do.
- Change failure rate on high-risk deploys: Segment by change-risk score. If scoring works, high-risk deploys should show a materially different failure rate than low-risk ones.
Predictive maintenance AI fails when ownership is ambiguous, incident history is inconsistently labeled, and nobody agrees on which signals matter, because a model can only amplify the clarity it is given. Shaped Clarity™ treats that shared operating reality as the deliverable: clear ownership, honest signal, and decisions that hold up as the product and the market keep moving. Prediction becomes a compounding asset once the organization underneath it is legible. Leverage Shaped Clarity to scale with purpose.
Conclusion
The teams that will run reliable digital products through the next cycle treat failure as forecastable and act on the forecast early, while a fix is still a scheduled change rather than an incident. Predictive maintenance using AI makes that possible, and the sequencing determines whether it delivers: signal integrity first, correlation second, advisory prediction third, and bounded autonomy only once the first three have earned trust. Winning will not depend on the most sophisticated models, but on agreement on what a severity-one incident is, who owns which service, and what the system is allowed to do without asking.
Move your product team from firefighting to forecasting: contact us or book a call.