


Two SaaS companies can report the same Net Revenue Retention and be heading in opposite directions: one expands steadily across a loyal base, while the other covers a leaking bucket with a handful of large upsells. Today, boards, acquirers, and investors can tell the difference, and they now ask for both numbers on the same slide.
Net Revenue Retention (NNR) is the percentage of recurring revenue a company keeps from an existing customer cohort over a period, after adding expansion and subtracting contraction and churn. Gross Revenue Retention (GRR) measures the same cohort without expansion. Because the GRR vs NNR gap is one of the clearest signals of product health for founders and leaders, we'll explore how to calculate Net and Gross Revenue Retention, what current retention benchmarks say, and which product decisions move each metric.
What is Net Revenue Retention (NNR) in SaaS?
Net Revenue Retention (NNR) is a SaaS metric that measures how much recurring revenue an existing customer base generates today compared with a starting point, usually twelve months earlier. Also called Net Dollar Retention (NDR), an NNR above 100% means the installed base is growing on its own, before a single new logo is signed.
NNR combines four movements inside one customer cohort:
- Starting revenue: the ARR or MRR the cohort generated on day one of the period.
- Expansion revenue: upsells, cross-sells, added seats, higher usage, and price increases.
- Contraction: downgrades, removed seats, lower usage, and renewal discounts.
- Revenue churn: recurring revenue lost when customers cancel or don't renew.
NNR matters because it shows how much of next year's growth is already inside the business. Given that expansion accounts for 40% of Net new ARR at the median, rising to 44% among low-growth companies, the base carries more of the plan if/when new-logo acquisition slows.
SaaS Capital's 2026 benchmark also reports a median NNR of 103% for bootstrapped companies with $3M-$20M ARR, while median revenue growth in that group fell from 20% to 15%. Retention held steady as acquisition got harder, which makes every point of NNR more valuable. For a strategist, NNR reads as a lagging indicator of value delivered. Each point represents a renewal conversation the product won, an expansion path it opened, or a downgrade it invited.
Gross Retention vs Net Retention: What is the Difference?
Gross Revenue Retention (GRR) measures how much starting revenue a company keeps after contraction and churn, but it excludes expansion, so it can never exceed 100%. In short, GRR shows how well the product holds its base, and NNR shows how well it grows that base.
NNR vs GRR: What Each Metric Reveals
- GRR reveals durability: depth of product-market fit, onboarding quality, value delivery, and renewal risk.
- NNR reveals growth potential: pricing architecture, packaging, and how naturally accounts grow.
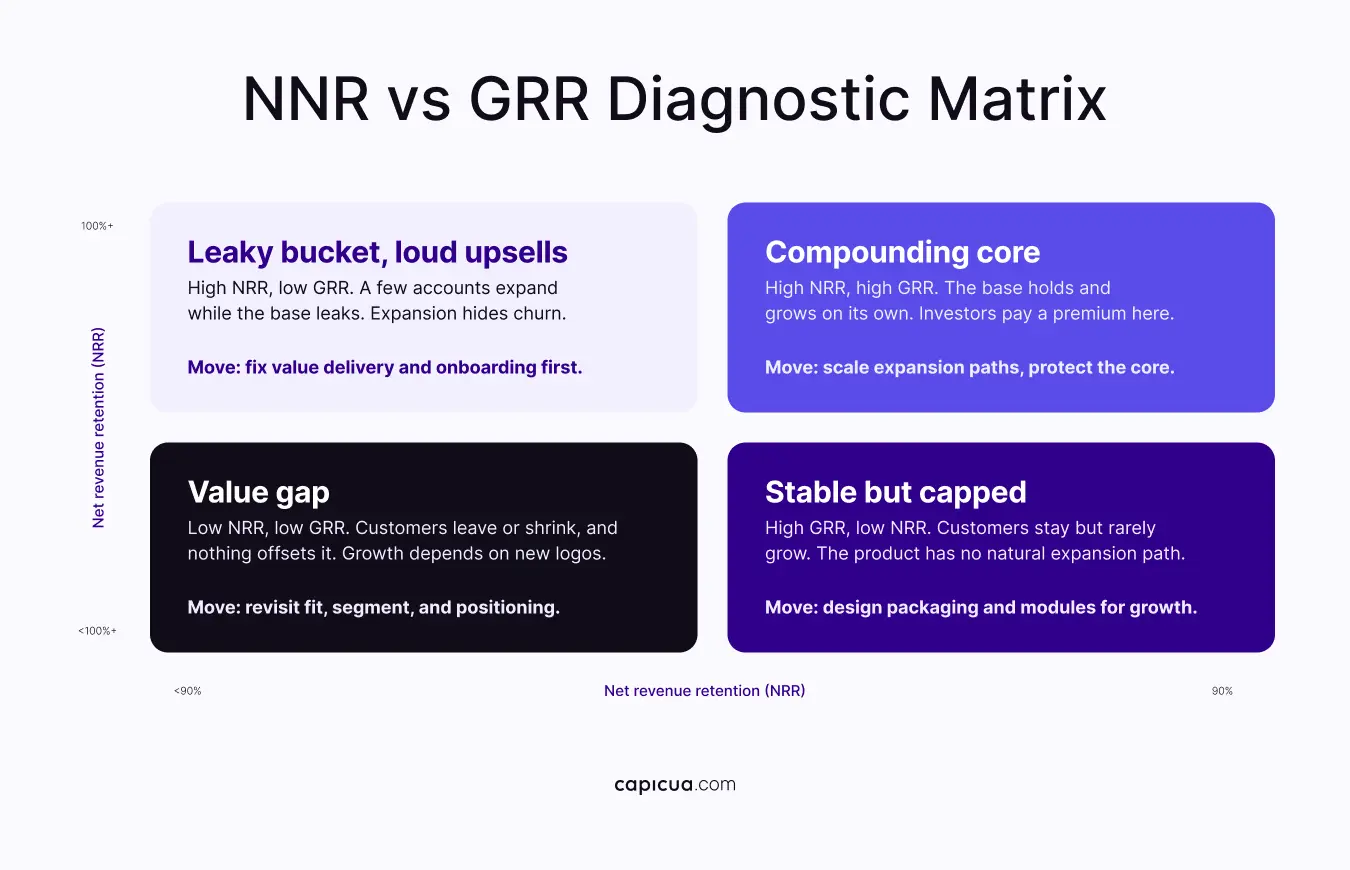
- The gap between NNR vs GRR reveals dependency: a wide gap means a subset of accounts is expanding fast enough to hide losses elsewhere.
Investors now treat Net retention vs Gross retention as a single diagnostic. ICONIQ added Gross retention to its growth index this year, and, as SaaStr reported in September 2026, median Gross dollar retention at $100M+ ARR sits at 90%. In M&A diligence, FE International warns that NNR "can mask seat contraction sitting underneath expansion revenue from AI add-ons," and expects buyers to request Gross and Net Revenue Retention by annual cohort and by product module.
Consider two companies at 115% NNR: the first has 82% GRR: almost a fifth of starting revenue walks out each year, and a small group of large accounts makes up the difference; the second has 95% GRR, so expansion builds on a base that barely moves. The headline number matches, but the risk profile and valuation conversation don't.
How to Calculate Net Revenue Retention and GRR
To calculate Net Revenue Retention, take the recurring revenue from a defined customer cohort at the start of a period, add expansion, subtract contraction and churn, then divide by the starting revenue. To calculate GRR, use the same formula without expansion.
To calculate NNR step by step:
- Fix the cohort: include only customers active on day one of the period, and exclude revenue from customers acquired during it.
- Record starting ARR for that cohort, or MRR multiplied by twelve.
- Sum expansion: upsells, cross-sells, added seats, usage growth, and price increases.
- Sum contraction: downgrades, removed seats, reduced usage, and discounts applied at renewal.
- Sum churned ARR from customers who canceled or did not renew.
- Apply both formulas and report the results side by side, ideally by cohort, segment, and product module.
For a worked NNR and GRR example, let's look at a cohort that starts the year at $10.0M ARR. Over twelve months, it adds $1.8M in expansion, loses $0.6M to contraction, and loses $0.7M to churn.
- NNR = ($10.0M + $1.8M - $0.6M - $0.7M) / $10.0M = 105%
- GRR = ($10.0M - $0.6M - $0.7M) / $10.0M = 87%
The base grew 5%, yet 13% of starting revenue leaked out. An 87% GRR sits above the 84% median in the Benchmarkit 2026 data and below its 91% 75th percentile, so this company has a healthy expansion motion and a retention problem worth solving before it compounds.
However, you must also consider common NNR calculator mistakes:
- Counting new customers' revenue, which inflates NNR and hides churn.
- Mixing monthly and annual cohorts in the same calculation.
- Using bookings or contract value instead of recognized recurring revenue.
- Reading a single month of usage-based revenue; trailing averages smooth swings.
- Blending segments, which lets enterprise expansion cover SMB churn.
Knowing how to calculate NNR correctly matters as much as the result. Buyers and boards will rebuild a clean cohort analysis during diligence anyway.
What is a Good NNR? SaaS Net Revenue Retention Benchmarks
A good NNR for B2B SaaS is above 100% for smaller companies and 115%-130% for growth-stage companies, while a healthy GRR is generally at or above 90%. Benchmarks shift with ARR scale, pricing model, and customer segment, so always compare to a peer group. Net Revenue Retention benchmarks by ARR stage are as follows:
- Under $10M ARR: median NNR of 105%.
- $10M to $25M ARR: median NNR of 125%.
- $25M to $100M ARR: median NNR peaks at 130%.
- $100M+ ARR: median NNR falls to 115%, with median Gross retention at 90%.
For Gross Revenue Retention benchmarks, the Benchmarkit 2026 report places median GRR at 84%, down from 88% the prior year, and the 75th percentile at 91%, down from 95%. Ben Murray of The SaaS CFO describes the four-point drop as a reset of what founders should treat as normal. Bootstrapped companies hold up better, as SaaS Capital reports a median GRR of 91% and a top-decile GRR of 100%, along with a top-decile NNR of 117.9%.
Before reading NNR benchmarks, remember that benchmarks are reference points, and trends within your own cohorts carry more signal than any single industry median. Compare against companies with a similar ACV, pricing model, and customer segment. Track NNR vs GRR over at least four quarters, and watch the gap: a widening spread usually signals growing dependence on a few accounts.

Why AI and Seat-Based Pricing Are Reshaping Net Revenue Retention
AI is compressing the seat-based expansion that historically drove much of SaaS Net Revenue Retention. When agents complete work that used to require more users, seat counts flatten or shrink, and NNR follows unless pricing captures value another way. Benchmarkit reports a median NNR of 108% for usage-based pricing and 98% for seat-based pricing, a 10-point gap that its authors describe as a structural determinant of NNR. Gartner estimates that agentic arbitrage will expose up to $234 billion of enterprise application spending by 2030 and frames the shift as a break in the traditional seat-license model. For founders and leaders, this means:
- Mapping where customers actually get value: outcomes, workflows, usage, or seats.
- Reporting AI add-on revenue separately, so new expansion does not hide legacy seat contraction.
- Watching renewal-time seat reductions as an early warning for both GRR and NNR.
- Designing expansion paths around the value metric customers already recognize.
For seat-based products, NNR can look stable for several quarters while the base shrinks underneath AI add-on revenue. Teams that separate streams early keep a truthful view of Gross vs Net Revenue Retention.

How to Improve Net Revenue Retention Through Product Strategy
Improving Net Revenue Retention starts with Gross Retention: protect the base by reducing time-to-value and limiting downgrade reasons, then build deliberate expansion paths into the product. Sales and customer success amplify NNR, and product decisions set its ceiling.
Product levers that raise Gross Revenue Retention include:
- Shorten time-to-value so new accounts reach their first meaningful outcome in days. Most avoidable churn starts in onboarding.
- Instrument health signals, such as active usage, feature depth, and workflow completion, and review them before renewal season.
- Use structured customer experience research to understand why customers downgrade, and route findings into the roadmap.
- Cut rework that ships features nobody adopts. Discovery sessions align product, design, and engineering on validated problems before the build starts.

Product levers that raise Net Revenue Retention include:
- Align packaging and pricing with a value metric customers already recognize, using market research techniques such as pricing research and win/loss analysis.
- Design module adoption paths so the second and third product areas feel like natural next steps.
- Trigger expansion from in-product signals, such as usage thresholds or new teams joining, rather than calendar dates.
- Put NNR and GRR by cohort and module into the operating rhythm, so leadership clarity extends to the metrics product teams own.
These levers compound. Teams that treat retention as a product outcome and plan for it like scaling a business tend to keep the GRR vs NNR gap narrow while both numbers rise.
A widening gap between Gross vs Net revenue retention usually traces back to blurred signals: teams ship features without a shared view of where customers find value, so the base leaks while a few accounts expand. Capicua's proprietary lens, Shaped Clarity™, connects user signals, product decisions, and business metrics so the product earns retention intentionally. Discover Shaped Clarity here.
Conclusion
Net Revenue Retention tells founders whether the base is growing; Gross Revenue Retention tells them whether that growth is durable. Read either number alone, and it can mislead. Read together, by cohort and by module, they show where the product creates value, where it leaks, and which bets deserve the next quarter. Design for both metrics before the next renewal cycle starts.
To protect your base and design expansion that lifts both NNR and GRR, contact us or book a call.